In the fast-paced and volatile world of cryptocurrencies, being able to accurately predict price movements can mean the difference between significant gains and devastating losses. Technical analysis has emerged as a powerful tool for investors and traders looking to gain an edge in the crypto markets. By studying historical price data, chart patterns, and various technical indicators, it’s possible to identify potential trends and make more informed trading decisions.
In this comprehensive guide, we’ll explore how you can leverage technical analysis to predict the price movements of cryptocurrencies. We’ll cover the fundamental concepts of technical analysis, introduce you to some of the most widely used indicators and patterns, and provide practical tips and strategies for applying these techniques to your crypto trading. Whether you’re a seasoned trader or just starting your journey in the crypto space, this article will equip you with the knowledge and skills to navigate the markets with greater confidence.
Understanding the Basics of Technical Analysis
Technical analysis is the study of historical market data, primarily focused on price and volume, to identify patterns and trends that can help predict future price movements. Unlike fundamental analysis, which examines the underlying factors that influence an asset’s intrinsic value, technical analysis relies on the assumption that past market behavior can be used to forecast future price action.
At the core of technical analysis are three key principles:
- Market Behavior is Cyclical: Technical analysts believe that markets tend to exhibit recurring patterns and cycles, which can be identified and leveraged to make informed trading decisions.
- Prices Reflect All Available Information: The current price of an asset is believed to reflect all known information about that asset, including economic, political, and social factors.
- History Tends to Repeat Itself: Technical analysts believe that patterns and trends observed in the past are likely to occur again in the future, allowing them to anticipate and capitalize on these recurring market behaviors.
By applying these principles, technical analysts aim to identify potential support and resistance levels, recognize chart patterns, and interpret various technical indicators to make informed trading decisions.
Key Technical Analysis Tools and Indicators
To effectively use technical analysis in the cryptocurrency market, it’s essential to familiarize yourself with some of the most widely used tools and indicators. Here are some of the most important ones:
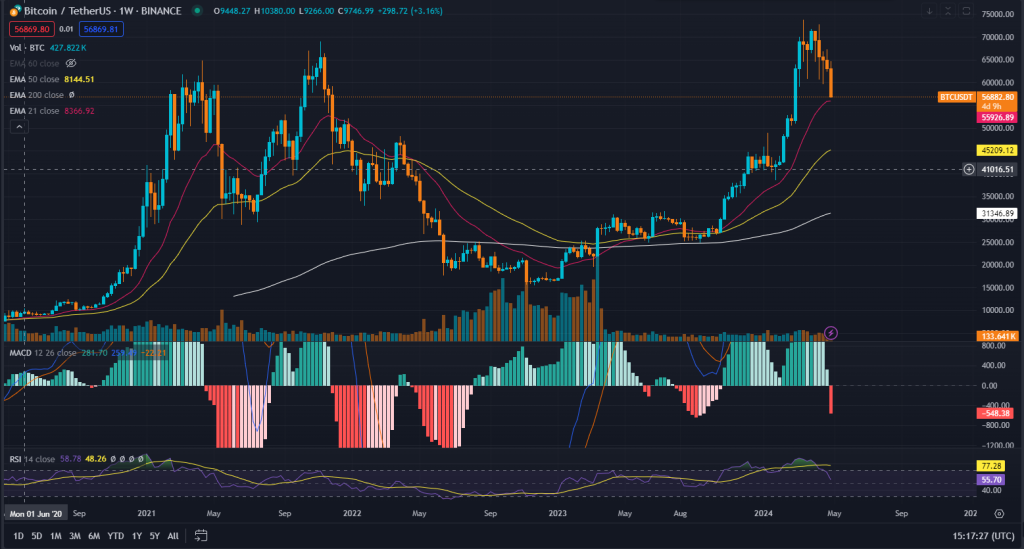
Moving Averages
Moving averages are one of the most fundamental and widely used technical indicators in the crypto space. They help smooth out price fluctuations and identify the overall trend direction. Some of the most common moving averages include the Simple Moving Average (SMA) and the Exponential Moving Average (EMA).
Moving averages can be used to identify support and resistance levels, spot potential trend reversals, and generate buy and sell signals. For example, a bullish crossover, where a shorter-term moving average crosses above a longer-term moving average, can be a signal to enter a long position.
Relative Strength Index (RSI)
The Relative Strength Index (RSI) is a momentum oscillator that measures the speed and change of price movements. It’s a widely used indicator that helps identify overbought and oversold conditions in the market. The RSI typically ranges from 0 to 100, with values above 70 indicating overbought conditions and values below 30 suggesting oversold conditions.
By monitoring the RSI, traders can identify potential price reversals and time their entry and exit points more effectively. For example, a bearish divergence, where the price makes a higher high but the RSI makes a lower high, can be a signal to consider taking profits or entering a short position.
Fibonacci Retracements
Fibonacci retracements are based on the Fibonacci sequence, a series of numbers where each number is the sum of the two preceding ones. In technical analysis, Fibonacci retracements are used to identify potential support and resistance levels, as well as to measure the depth of a price retracement.
The most common Fibonacci retracement levels are 23.6%, 38.2%, 50%, and 61.8%. These levels are often used to identify potential areas where the price may find support or resistance, allowing traders to make more informed decisions about their entry and exit points.
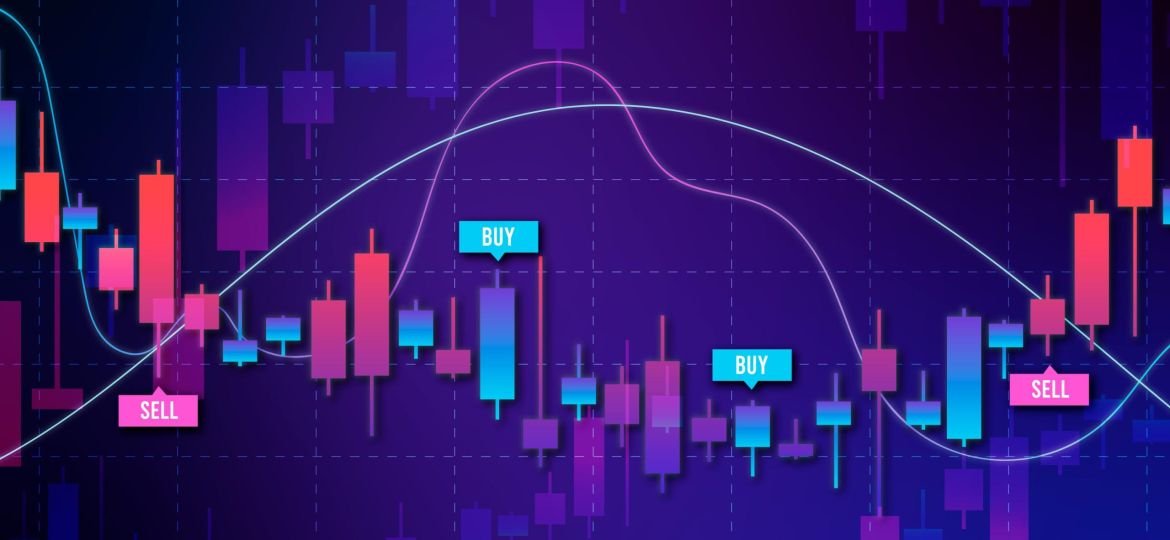
Candlestick Patterns
Candlestick patterns are a visual representation of the price action over a specific time frame. These patterns can provide valuable insights into market sentiment and potential future price movements. Some of the most well-known candlestick patterns include the bullish engulfing pattern, the hammer, the doji, and the bearish harami.
By recognizing and interpreting these candlestick patterns, traders can identify potential support and resistance levels, spot potential trend reversals, and make more informed trading decisions.
Volume Analysis
Volume analysis is an important aspect of technical analysis, as it provides insights into the strength and conviction behind price movements. By monitoring trading volume, traders can identify potential support and resistance levels, spot potential trend reversals, and confirm the validity of chart patterns.
For example, a significant increase in trading volume during a price breakout can be a sign of a strong trend, while a decrease in volume during a price decline may indicate a potential reversal.
Want to enter the elite 5% in the volatile world of cryptocurrencies?
Your key is in this course!
I’ve been trading cryptocurrencies for more than 4 years, and I’ve made money, but a lot of new investors are losing money. Stay away from them!
This course, designed for beginners, will:
+ Crack the code on cryptocurrency charts.
+ Impart to you effective trading techniques
+ Make you more knowledgeable than 95% of traders
+ Gain LIFETIME access to our Discord channel for continuous assistance!
Only a few seats remain, so register now!
Applying Technical Analysis to Cryptocurrency Trading
Now that you have a basic understanding of the key technical analysis tools and indicators, let’s explore how you can apply these concepts to your cryptocurrency trading strategy.
Identify Trends and Support/Resistance Levels
One of the primary goals of technical analysis is to identify the overall trend direction of a cryptocurrency. By using moving averages, you can determine whether the market is in an uptrend, a downtrend, or a sideways/consolidation phase. This information can help you make more informed trading decisions, such as when to enter a long or short position.
Additionally, identifying support and resistance levels can be crucial in determining your entry and exit points. Support levels are areas where the price has historically found buying pressure and bounced back up, while resistance levels are areas where the price has faced selling pressure and struggled to break through. By identifying these key levels, you can time your trades more effectively and manage your risk more efficiently.
Recognize Chart Patterns
Chartists often look for specific chart patterns that can signal potential price movements. Some of the most common and reliable patterns include:
- Head and Shoulders: A reversal pattern that indicates a potential trend change.
- Double Tops and Bottoms: Reversal patterns that suggest a potential trend change.
- Triangles: Continuation patterns that can signal the direction of the next price move.
- Flags and Pennants: Continuation patterns that can indicate the continuation of an existing trend.
By recognizing these patterns and understanding their implications, you can anticipate potential price movements and adjust your trading strategy accordingly.
Utilize Technical Indicators
Technical indicators can provide valuable insights into market sentiment, momentum, and potential price actions. Some of the most useful indicators for cryptocurrency trading include:
- Relative Strength Index (RSI): Helps identify overbought and oversold conditions.
- Moving Average Convergence Divergence (MACD): Measures momentum and can signal trend changes.
- Stochastic Oscillator: Measures the momentum of a cryptocurrency’s price movement.
- Bollinger Bands: Identify volatility and potential support and resistance levels.
By combining multiple technical indicators and analyzing their signals in conjunction, you can develop a more comprehensive understanding of the market and make more informed trading decisions.
Incorporate Volume Analysis
As mentioned earlier, volume analysis is a crucial component of technical analysis. By monitoring trading volume, you can confirm the validity of chart patterns, identify potential support and resistance levels, and gauge the strength of a trend.
For example, a price breakout accompanied by a significant increase in trading volume is generally considered a stronger signal than a breakout with low volume. Conversely, a price decline with decreasing volume may suggest a potential reversal or consolidation.
Utilize Multiple Time Frames
Successful cryptocurrency traders often analyze the market across multiple time frames, from short-term (e.g., 1-hour, 4-hour) to long-term (e.g., daily, weekly). By examining the price action and technical indicators across different time frames, you can gain a more comprehensive understanding of the market’s dynamics and make more informed trading decisions.
For instance, a short-term uptrend may be confirmed by a longer-term bullish trend, providing a stronger signal to enter a long position. Conversely, a short-term downtrend that is part of a larger uptrend may present an opportunity to buy the dip.
Stay Up-to-Date with Market Trends
The cryptocurrency market is constantly evolving, with new trends, technologies, and market dynamics emerging regularly. To effectively apply technical analysis, it’s crucial to stay up-to-date with the latest market developments, news, and industry trends.
This may involve following reputable crypto news sources, participating in online forums and communities, and continuously educating yourself on the latest technical analysis techniques and strategies. By staying informed, you can adapt your trading approach to the changing market conditions and make more informed decisions.
Developing a Successful Technical Analysis-Based Trading Strategy
Leveraging technical analysis to predict the price movements of cryptocurrencies is not a one-size-fits-all approach. Developing a successful trading strategy requires a combination of research, practice, and continuous refinement. Here are some steps to help you create a technical analysis-based trading strategy for the crypto markets:
- Define Your Trading Goals and Risk Tolerance: Clearly define your investment objectives, risk appetite, and the amount of capital you’re willing to allocate to your crypto trading activities. This will help you develop a trading strategy that aligns with your personal financial goals and risk tolerance.
- Choose Your Trading Instruments: Identify the cryptocurrencies you want to focus on, taking into account factors such as market capitalization, liquidity, and volatility. Diversifying your portfolio across multiple cryptocurrencies can help mitigate risk.
- Develop Your Technical Analysis Toolkit: Familiarize yourself with the various technical analysis tools and indicators discussed in this article, and experiment with different combinations to find the ones that work best for your trading style and the cryptocurrencies you’re monitoring.
- Backtest and Refine Your Strategy: Before implementing your trading strategy in live markets, backtest it using historical data to evaluate its performance and identify areas for improvement. This will help you refine your approach and increase your chances of success.
- Start with a Demo Account: Consider practicing your technical analysis-based trading strategy on a demo account before risking your own capital. This will allow you to test your approach, refine your execution, and build confidence without the pressure of real-money trades.
- Continuously Monitor and Adapt: The cryptocurrency market is highly dynamic, and what works today may not work tomorrow. Regularly review and adjust your trading strategy based on changing market conditions, new technical indicators, and your own trading experiences.
- Manage Your Risks Effectively: Implement robust risk management practices, such as setting stop-loss orders, diversifying your portfolio, and controlling your position sizes. This will help you minimize your downside and protect your capital in the event of unexpected market movements.
- Stay Disciplined and Patient: Successful crypto trading requires discipline, patience, and the ability to control your emotions. Avoid impulsive decisions and stick to your well-researched trading plan, even in the face of market volatility.
By following these steps and continuously refining your technical analysis-based trading strategy, you can increase your chances of successfully predicting the price movements of cryptocurrencies and achieving your investment goals.
Ready to take your cryptocurrency knowledge to the next level? This course will teach you advanced strategies for investing in and using cryptocurrency. Link Here

Conclusion
Technical analysis can be a powerful tool for navigating the volatile and unpredictable cryptocurrency markets. By understanding the fundamental principles of technical analysis, familiarizing yourself with the most useful indicators and patterns, and developing a well-structured trading strategy, you can gain a competitive edge and make more informed trading decisions.
Remember, the cryptocurrency market is constantly evolving, and staying up-to-date with the latest trends and industry developments is crucial for the long-term success of your technical analysis-based trading approach. Continuous learning, practice, and discipline are the keys to mastering the art of predicting cryptocurrency price movements using technical analysis.
Good luck on your journey to becoming a successful crypto trader!


